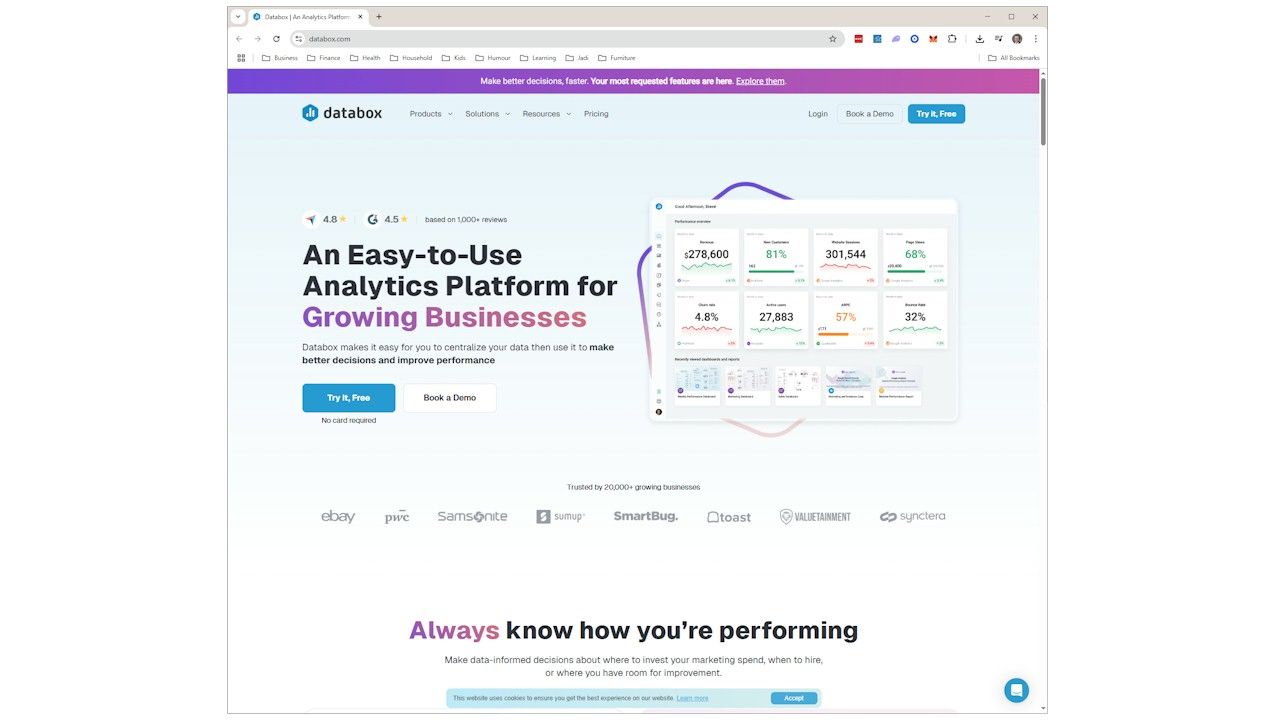
Databox: Real-Time Dashboards for Outcome-Driven Teams
In software and game development orgs, data is everywhere—but insight is rare. Teams juggle velocity metrics, engagement curves, QA trends, support loads, monetization funnels, and a dozen other KPIs. Everyone’s tracking something, but few are seeing the whole picture.
Databox exists to solve that problem.
It’s a real-time dashboarding and KPI-tracking tool that helps teams stay focused on what matters most—without drowning in metrics or wasting time building reports. Think of it as the glue between your data sources and your day-to-day decision-making.
Tool link: https://databox.com
Where Databox Came From
Founded in 2012, Databox emerged from a common pain point: analytics tools were either too complex, too siloed, or too slow. Most companies had to rely on analysts or spreadsheets to pull together performance snapshots, which meant that frontline teams operated in the dark between updates.
Databox set out to fix that. It’s built for accessibility, speed, and action. The vision? Make it easy for any team—regardless of technical skill—to understand how they’re performing, in real time.
Today, it powers thousands of dashboards across industries, including SaaS, mobile gaming, e-commerce, and services. For software and game development teams, its sweet spot is visibility: helping leaders, PMs, and cross-functional groups stay aligned on shared metrics—without spinning up a new tool for every function.
What Databox Is (and Isn’t)
Let’s clarify: Databox is not a BI platform like Tableau or Power BI. It’s not meant for deep-dive analysis or dashboard engineering. What it is is a fast, flexible way to visualize the most important KPIs in one place—and keep them front-of-mind across your team.
Here’s what you get:
- Real-Time Dashboards: Pull live data from tools like Google Analytics, HubSpot, Mixpanel, Jira, PostgreSQL, and dozens of others. No manual updating. No exporting to spreadsheets. Just live KPIs that stay current.
- Goal Tracking: Set specific targets and track progress over time. Useful for OKRs, sprint goals, revenue milestones, or player retention benchmarks.
- Alerts & Scorecards: Get daily/weekly summaries emailed or sent via Slack. Set up alerts for when metrics spike, drop, or hit thresholds—perfect for live ops or support KPIs.
- Mobile-Friendly: Databox was built with mobile use in mind. You can check your KPIs from your phone, at your desk, or in a daily standup—without squinting at a spreadsheet.
Why Databox Matters for Software & Game Dev Teams
In complex dev orgs, metrics are fragmented. Engineering lives in Jira. QA lives in TestRail or internal tools. Product uses Mixpanel or Firebase. Support runs Zendesk. Execs stare at revenue dashboards in Looker or Snowflake.
The problem isn’t a lack of data—it’s a lack of shared visibility.
Databox acts as a cross-team layer of insight. It helps leaders and teams answer questions like:
- “Are we hitting our delivery goals?”
- “Is player sentiment improving after last week’s patch?”
- “Are crashes going down across platforms?”
- “What’s the shape of our monetization this week?”
- “Where’s the bottleneck right now?”
By surfacing the most important metrics, clearly and consistently, Databox gives teams a single source of focus. It’s not about showing everything. It’s about showing what matters—right now.
How Databox Is Formed
Dashboards in Databox are built from Data Sources, Datablocks, and Databoards:
- Data Sources: These are your connected tools—Google Analytics, Jira, Stripe, Firebase, MySQL, Excel, etc. Databox supports over 100 integrations out of the box. You authenticate once and choose the metrics you want to track.
- Datablocks: Datablocks are the visual components—charts, numbers, tables—that show your metrics. Each block can be customized with filters, time ranges, goals, and comparisons.
- Databoards: A Databoard is the full dashboard—a collection of Datablocks built for a specific purpose. You can create a Product Health board, a Sprint Metrics board, a Live Ops dashboard, or a Studio KPI board. Each board updates automatically and can be shared via link, embed, or email. It’s like building a “mission control” panel—but fast.
Common Use Cases in Game and Software Teams
Here are just a few practical ways Databox can be used across your org:
Engineering
- Burndown trends
- Bug open/close rates
- Deploy frequency
- Code review throughput Pull from Jira, GitHub, and internal tools to track team health at a glance.
Live Ops / Product
- DAU/WAU/MAU
- Crash-free sessions
- ARPU / Conversion Rate
- Retention curves Databox can pull from Mixpanel, Firebase, Segment, and custom sources to track real-time player metrics.
Executive Dashboards
- OKR progress
- Studio-level KPIs
- Revenue by product or platform
- Cross-functional milestone tracking Perfect for board meetings, studio syncs, or leadership standups.
Support & Community
- Ticket volume and SLA times
- CSAT/NPS scores
- Top complaint drivers by tag Integrate Zendesk, Intercom, or spreadsheets to build visibility into the player experience.
Smart Practices for Using Databox Effectively
- Start Small. Pick 3–5 key metrics for your team or function. Don’t try to track everything—track what drives your decisions.
- Use Goals. Tie each metric to a target. Whether it’s 4.5 stars on the App Store, 95% crash-free rate, or $100K in monthly IAP revenue—make progress visible.
- Build for Meetings. Design dashboards that support real-time discussion in reviews, planning sessions, and retros. Label your charts with meaning, not just numbers.
- Schedule Scorecards. Send weekly KPI summaries to Slack or email. It keeps metrics top of mind and removes the burden of “checking the dashboard.”
- Review What’s Working. Databox tracks which dashboards get viewed, how often, and by whom. Use this data to prune and improve.
Where to Learn More
- Main site: https://databox.com
- Dashboard templates: https://databox.com/dashboard-examples
- Integration list: https://databox.com/integrations
- Knowledge base: https://help.databox.com
Final Thought: Make Metrics Useful Again
Most teams don’t lack data—they lack clarity. Metrics live in silos. Reporting is reactive. Dashboards are built for show, not for use.
Databox flips that script. It gives you a way to make your most important numbers visible, timely, and actionable. No more digging. No more waiting. No more wondering what’s going on.
And in high-output teams—where the ability to see clearly, adjust quickly, and align cross-functionally is the difference between stalling and scaling—that visibility is more than a nicety.
It’s operational leverage.
So if you’re tired of building slide decks, updating spreadsheets, or chasing down numbers before every meeting—Databox might be the one dashboard tool that actually makes life easier.
Because in the end, you can’t lead what you can’t see.
